




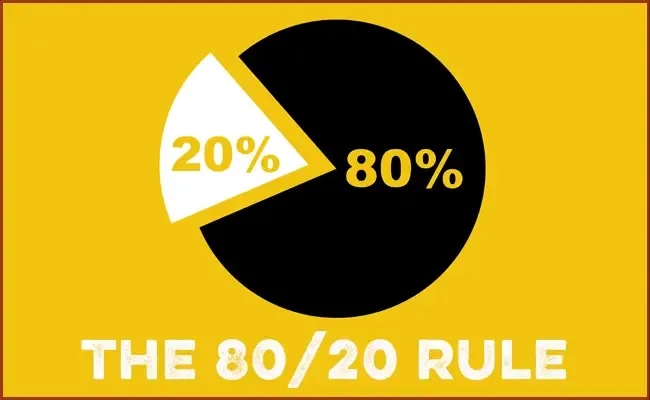

The 80/20 rule in inventory says a small share of your products, roughly 20%, ties up most of your stock money, roughly 80%. ABC analysis puts the rule to work: rank products by yearly cost value, then give the top group the closest control. Your own split will rarely be exactly 80/20.
The rule takes its name from the economist Vilfredo Pareto. The Juran Institute explains how Joseph Juran made it a general principle: the "vital few" and the "useful many". Its own examples land at 65% and 82%, not 80%.
How to do ABC analysis, step by step
- List every product with the units sold in the last 12 months.
- Multiply units by cost price to get each product's annual cost value. Use cost, not selling price, because the question is where your money is tied up.
- Sort from the highest value to the lowest.
- Add a running total and turn it into a percentage of the grand total.
- Cut the list: A up to 80% of the value, B up to 95%, C the rest. Choose the cut-offs before you start, and keep them.
A worked example: a Kampala mini-market
For example, take a mini-market in Kampala and 12 of its products. The quantities and costs are illustrative, in Uganda shillings, for one year.
| Product | Sold in a year | Cost each | Annual cost value | Running total | Class |
|---|---|---|---|---|---|
| Cooking oil, 3 litres | 1,200 | 26,000 | 31,200,000 | 26.5% | A |
| Sugar, 2 kg | 2,400 | 8,500 | 20,400,000 | 43.9% | A |
| Maize flour, 2 kg | 3,600 | 4,500 | 16,200,000 | 57.7% | A |
| Bread, 400 g | 4,800 | 3,000 | 14,400,000 | 69.9% | A |
| Rice, 5 kg | 600 | 21,000 | 12,600,000 | 80.6% | B |
| Milk, 500 ml | 7,200 | 1,500 | 10,800,000 | 89.8% | B |
| Bar soap | 1,500 | 3,500 | 5,250,000 | 94.3% | B |
| Tea leaves, 250 g | 900 | 3,500 | 3,150,000 | 97.0% | C |
| Toothpaste | 400 | 4,500 | 1,800,000 | 98.5% | C |
| Phone charger | 60 | 12,000 | 720,000 | 99.1% | C |
| Salt, 1 kg | 600 | 1,000 | 600,000 | 99.6% | C |
| Matches, pack of 10 | 300 | 1,500 | 450,000 | 100.0% | C |
| Total | 117,570,000 |
Four products out of 12, a third of the range, hold 70% of the money. The five C products hold under 6% between them. That is the Pareto pattern, but not the 80/20 numbers.
Rice shows why the cut-off rule matters. It takes the running total from 69.9% to 80.6%, just past the line, so it lands in B. Some shops put the product that crosses the line into A instead: either rule works if you keep to it.
The spreadsheet formulas to copy
Put one product per row, from row 2 to row 13, in these columns. The formulas work in Excel and Google Sheets.
| Column | Holds | Row 2 |
|---|---|---|
| A | Product name | Typed in |
| B | Units sold in 12 months | From your sales report |
| C | Cost each | From your product list |
| D | Annual cost value | =B2*C2 |
| E | Share of the total | =D2/SUM($D$2:$D$13) |
| F | Running total | =SUM($E$2:E2) |
| G | Class | =IF(F2<=0.8,"A",IF(F2<=0.95,"B","C")) |
Sort the rows by column D, largest first, then copy row 2's formulas down to your last product. Change 13 to your last row number.
What to do with each class
Each class gets its own counting, ordering and supplier routine. The schedule below is a common starting point, not a rule.
| Class | Count | Reorder | Suppliers |
|---|---|---|---|
| A | Every week or month | A reorder level on each product; never let it run out | Two suppliers where you can, prices checked before each order |
| B | Every month or quarter | A reorder level, checked monthly | One reliable supplier |
| C | At the full stock take | Small lots, bought less often; drop lines that don't sell | Whoever has it when you need it |
Counting A items more often is the idea behind a cycle count, done without closing the shop. The difference between a full count and a spot check is in stock taking or stock checking.
ABC ranks money, not urgency
ABC sorts products by the money they tie up. It says nothing about how fast they spoil, or how much customers expect to find them.
- Perishables need daily attention whatever their class. Milk is a B product in the example, yet it goes off in days.
- Some C products bring customers in. Salt and matches hold under 1% of the money, but a shop without them sends customers to the next kiosk. Keep them, in small quantities.
- A cheap product can earn more than its class suggests. Rank by gross profit as well as cost before you drop a line. A C product with a wide margin, such as a phone charger, can climb that list.
Mistakes that break the rule
- Ranking by selling price. It lifts products with high markups up the list. Rank by cost when the question is stock money.
- Ranking once and never again. Re-rank every quarter, because school terms and the festive season reshuffle the list. A tool that keeps sales by product makes that a short job: see time-saving tools for small retail.
- Overstocking C products to save a trip. Keeping too much slow-moving stock ties up cash that A products need.
- Treating 80/20 as a target. Your split is whatever your numbers say. A group that turns slowly shows up in the inventory turnover ratio too.
How to do ABC analysis in ArmPOS
ArmPOS's inventory management software keeps the sales and costs the sheet needs. Here is the route.
- Export units sold. Open Reports › Product sales report, set the last 12 months, and click EXCEL. Each line has the product Name and Qty sold. See Sales reports.
- Get each product's cost. Reports › Inventory Valuation shows the Cost beside every product. See Stock reports.
- Total the units by product in the spreadsheet, with a pivot table or SUMIF, then apply the formulas above.
- Protect the A products. Give each one a Stock Alert, so it shows as low stock before it runs out. See Add your first products, and turn on alerts on your phone.
- Count A products more often. Products › Count Stock makes a count sheet for one warehouse and one category. See Count and adjust stock.
- Review the C list. The Dead Stock Report lists products that haven't moved in the last 30, 60 or 90 days. The Zero Sales Products Report lists those that haven't sold.
On plans that include AI Reports, a ready question lists your top products by profit, for the gross profit view. See AI reports.
Frequently asked questions
Is ABC analysis the same as the 80/20 rule?
ABC analysis applies the 80/20 rule. It adds three classes and fixed cut-offs, so you can act on each group.
How often should I redo the analysis?
Every quarter, and after any big season. A product's class can change when its price or demand changes.
Should I stop selling C products?
Not automatically. Drop the ones that don't sell, and keep the cheap ones customers expect to find, in small quantities.
Can I rank by profit instead of cost?
Yes, for decisions about shelf space and promotion. Rank by cost for decisions about how much money to tie up in stock.
The sheet takes minutes once your sales are recorded by product. Create a free ArmPOS account to keep that record from your first sale; shops in Uganda can start from ArmPOS in Uganda.